Figure 7.

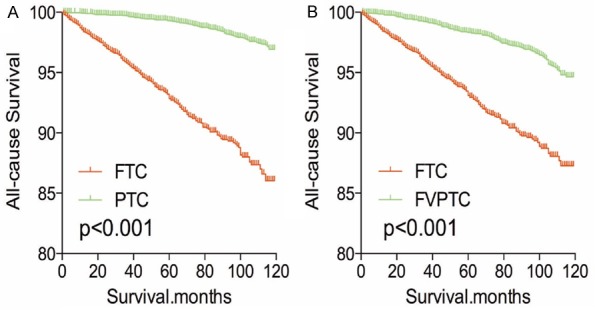
Kaplan Meier curves of all cause mortality for matched subtype pairs. Age, sex, race, T/N/M stage, multifocality, extension, surgery and radiation treatment matching between FTC and PTC (A), FTC and FVPTC (B).

Kaplan Meier curves of all cause mortality for matched subtype pairs. Age, sex, race, T/N/M stage, multifocality, extension, surgery and radiation treatment matching between FTC and PTC (A), FTC and FVPTC (B).