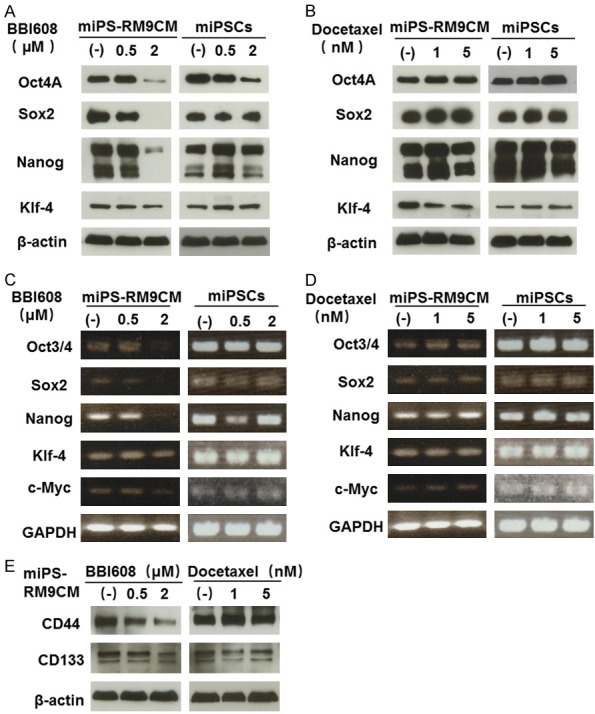
Figure 4.

Protein and gene expression analysis of stemness factor and CSC surface marker in miPSCs and miPS-RM9CM cells treated with BBI608 and docetaxel. A and B. Western blot analysis of Oct4A, Sox2, Nanog and Klf-4 expression in miPSCs and miPS-RM9CM cells with BBI608 or docetaxel treatment for 24 h. C and D. RT-PCR analysis of Oct3/4, Sox2, Nanog and Klf-4 expression in miPSCs and miPS-RM9CM cells with BBI608 or docetaxel treatment for 24 h. GAPDH served as a loading control. E. The expression of CD133 and CD44 in miPS-RM9CM cells with BBI608 or docetaxel treatment for 24 h. β-actin was used as a loading control. Results are representative of three independent experiments.
