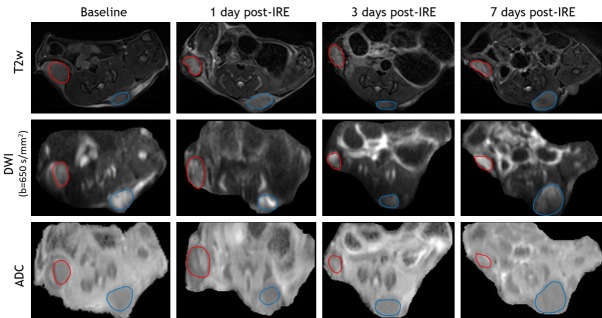
Figure 1.
Representative MR images. T2W images, DWI, and ADC maps of baseline, 1 day post-IRE, 3 days post-IRE, and 7 days post-IRE (IRE-treated tumor-red cycle, untreated tumor-blue cycle). These tumor masses were hyperintense (signal intensity is higher than normal muscle signal intensity) within T2W images and DWI images. IRE-treated tumors were typically isointense within ADC maps while untreated tumors were hypointense.

