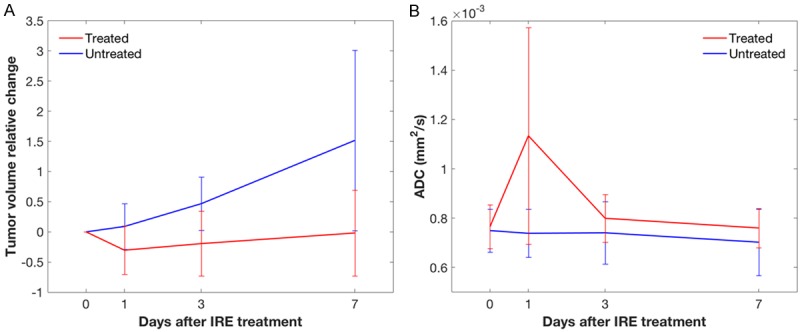
Figure 2.

Volume variation and ADC variation after IRE. Relative volume change in treated (red) and untreated (blue) tumors at baseline (0 days), 1, 3 and 7 days after IRE; the error bars represent the standard deviation across the 7 studied mice, showing a high variability in both groups (A). Mean ADC in treated (red) and untreated (blue) tumors at baseline (0 days), 1, 3 and 7 days after IRE; the error bars represent the standard deviation across the 7 studied mice, showing a high variability especially in treated lesions at 1 day (B).
