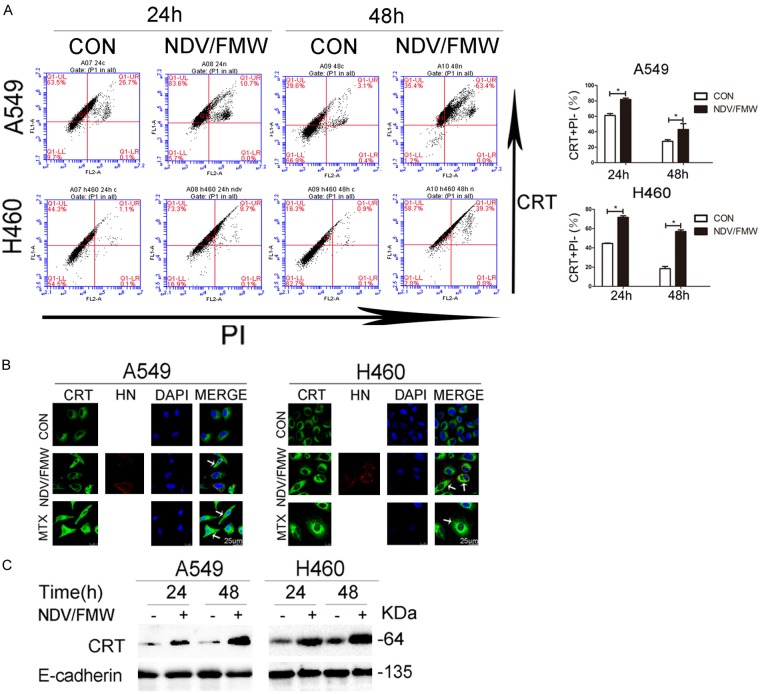
Figure 2.
NDV induces calreticulin (CRT) exposure in response to NDV. A. A549 and H460 cells were infected or mock-infected with NDV/FMW (MOI = 1) for 24 and 48 h. Cells were subjected to surface immunofluorescence staining to detect CRT in viable, PI-negative cells. Representative dot plots (left panel) and quantification data (right panel) are shown. Data are shown as Mean ± S.D. for three independent replicates (*P<0.05). B. Translocation of calreticulin (CRT) was assessed by immunofluorescence staining. The ICD inducer, mitoxantrine (MTX), was used as a positive control. DAPI was used for nuclear staining. NDV was detected based on the expression of hemagglutinin-neuraminidase protein (HN). Images were obtained using confocal microscopy (scale bar = 25 μm), arrowheads indicate positive area. Images are representative of three independent experiments. C. Cell membranes was isolated and subjected to immunoblot (IB) analysis while E-cadherin was used as a membrane marker. Immunoblots shown are representative of two independent experiments.

