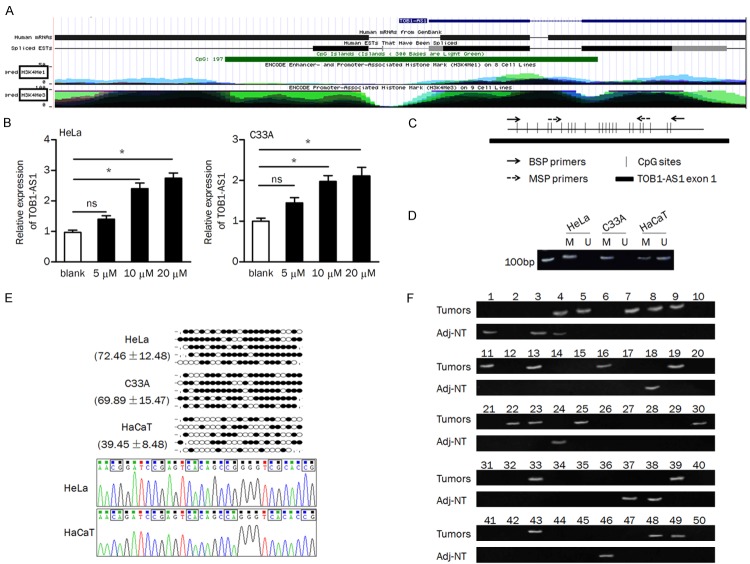
Figure 2.
DNA methylation regulated the expression of TOB1-AS1. A. Schema of the TOB1-AS1 location from the UCSC Genome Browser, Green block indicates the CpG island. B. HeLa and C33A cells were treated with 5-aza (0/5/10/20 μM) for three days and TOB1-AS1 expression was tested. C. Schema of the map of the TOB1-AS1-related CpG island and location of the primers; CpG sites are indicated with vertical ticks. D. The methylation status of TOB1-AS1 in cells was examined by MSP; M, methylated; U, unmethylated. E. Methylation status of the 23 CpG sites and representative sequences of bisulfite sequencing analysis in cells. Black dot, methylated CpG; white dot, unmethylated CpG; stub, not available. F. The methylation status of TOB1-AS1 in tumors and adjacent non-tumor tissues; methylated products were observed in 18 tumors and 8 normal tissues, respectively. ns, no significance; Adj-NT, adjacent nontumorous tissues. *P<0.05.

