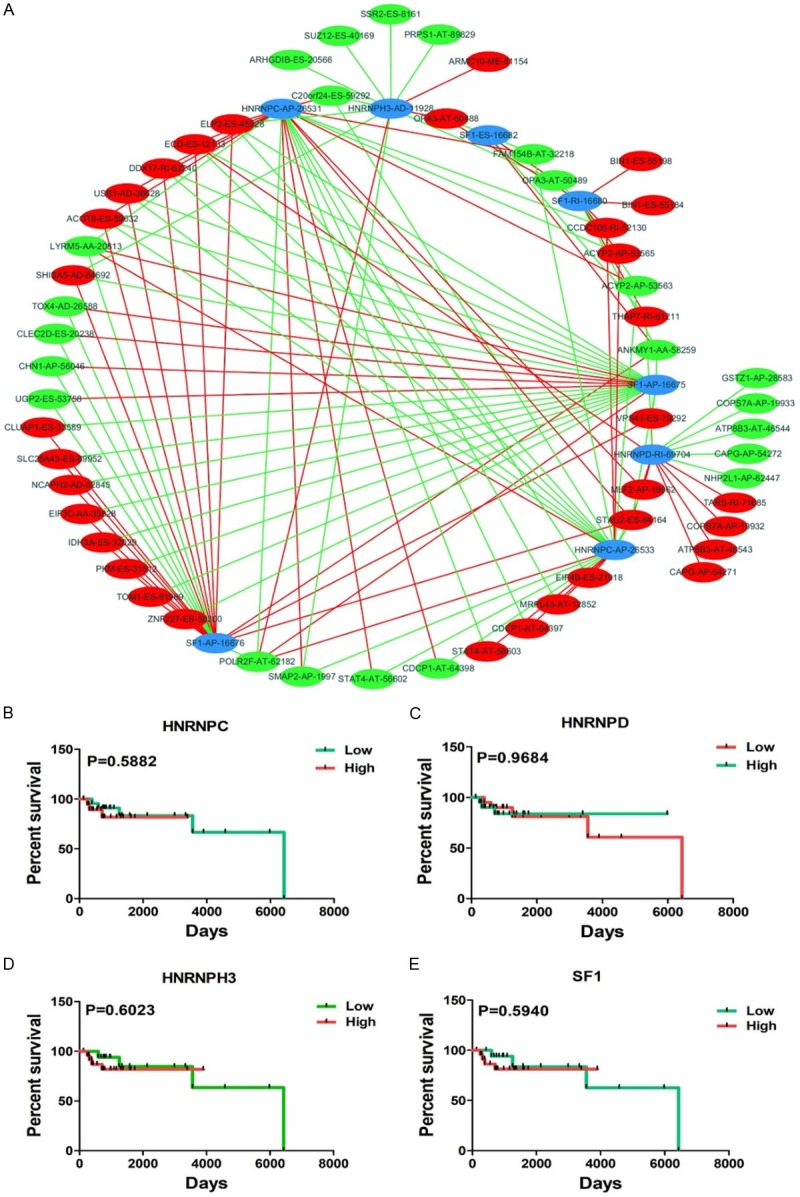
Figure 4.

Correlation splicing network and Kaplan-Meier curves for OS splicing factors. A. Splicing network of OS-related AS variants. The blue dots represent the AS events from OS-related splicing factors. The red/green dots represent the AS events that are positively (red lines) or negatively (green lines) associated with AS events from splicing factors. B-E. Kaplan-Meier curves for four splicing factors in DLBCL. The red line represents the high level group and the green line represents the low level group.
