
Figure 4.
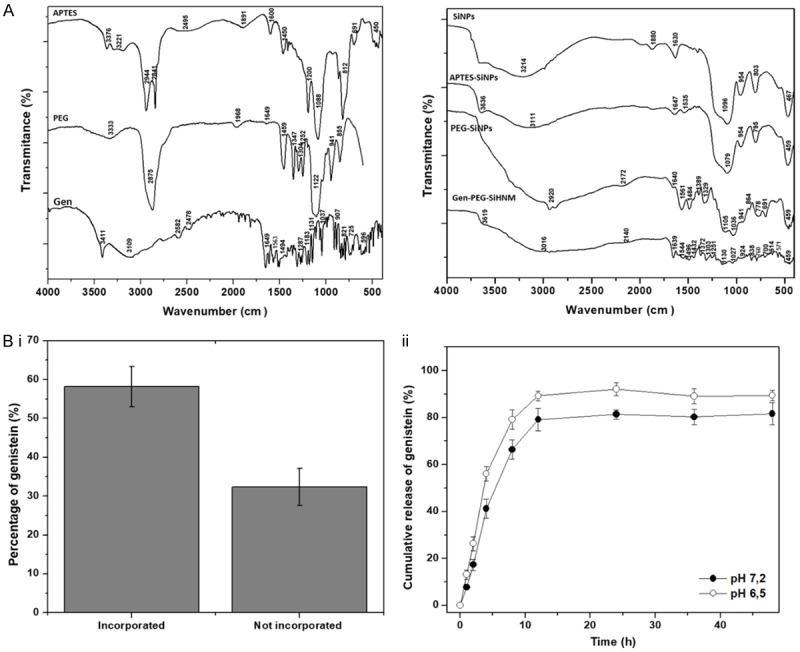
A. DRIFT spectra of APTES, PEG, genistein (Gen), silica nanoparticles (SiNPs), APTES-silica nanoparticles (APTES-SiNPs), PEGylated silica nanoparticles (PEG-SiNPs), and genistein-PEGylated silica hybrid nanomaterials (Gen-PEG-SiHNM). DRIFT spectrum represents the mean of 16 scans. B. Percentage of incorporated and not incorporated genistein into PEGylated silica nanoparticles (i), and cumulative release of genistein after 48 h of assessment in PBS:EtOH buffer at pH 7.2 and 6.5 (ii). All results represent the mean ± SE of five different batches examined by triplicate. Determinations were carried out by UV-Vis spectroscopy at 420 nm.