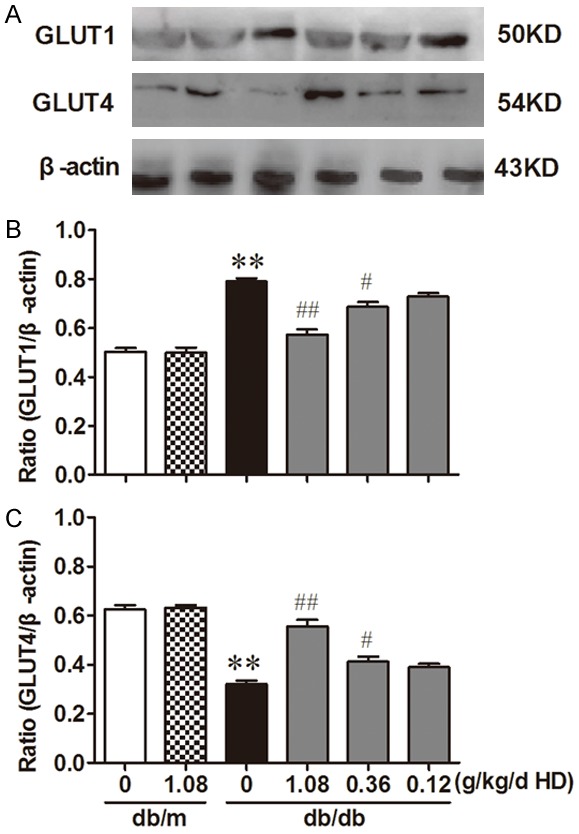
Figure 6.

Influence of HD on the expression of GLUT1 and GLUT4 Data are representative images for GLUT1, GLUT4. (A) Influence of HD on the expression of GLUT1 and GLUT4; (B, C) is the statistic analysis of A. Protein expression is shown relative to β-actin. **P < 0.001, compared with db/m group; ##P < 0.001, #P < 0.05, compared with db/db group (n = 10).
