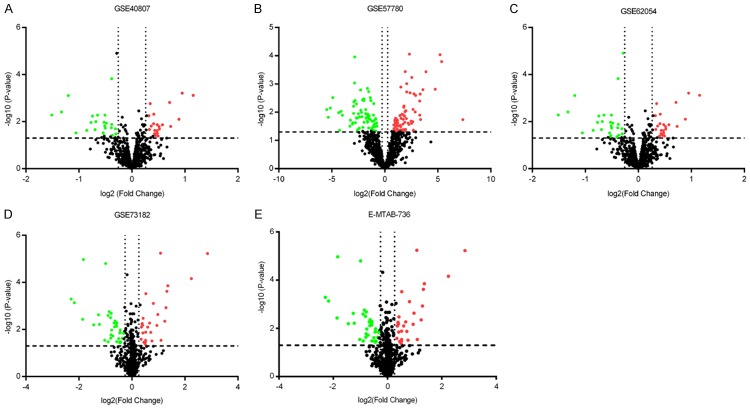
Figure 2.
Expression of miRNAs in thyroid cancer datasets. miRNA expression was analyzed in each included dataset: GSE40807 (A), GSE57780 (B), GSE62054 (C), GSE73182 (D), and E-MTAB-736 (E). The P values of differences in miRNA expression in thyroid cancer tissues compared to non-cancerous tissues are plotted versus the fold-change to identify up-regulated (red) and down-regulated (green) genes. The cut-off value for the fold-change was 1.2.

