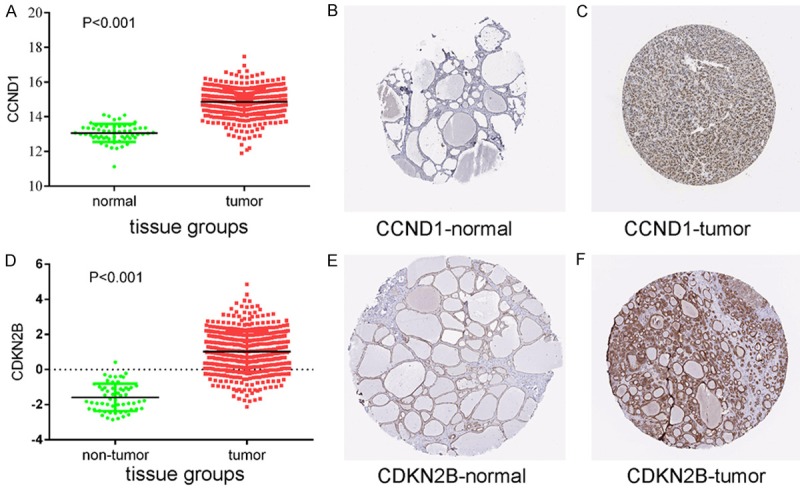
Figure 8.

Protein expression levels of potential target genes CCND1 and CDKN2B. Up-regulation of CCND1 expression in tumor tissues compared to normal tissues was shown graphically using data from TCGA (P < 0.001) (A) as well as by representative immunostaining images from The Human Protein Atlas of normal thyroid (B) and thyroid tumor (C) tissues. Likewise, up-regulation of CDKN2B expression in tumor tissues compared to normal tissues was shown graphically using data from TCGA (P < 0.001) (D) as well as by representative immunostaining images from The Human Protein Atlas of normal thyroid (E) and thyroid tumor (F) tissues.
