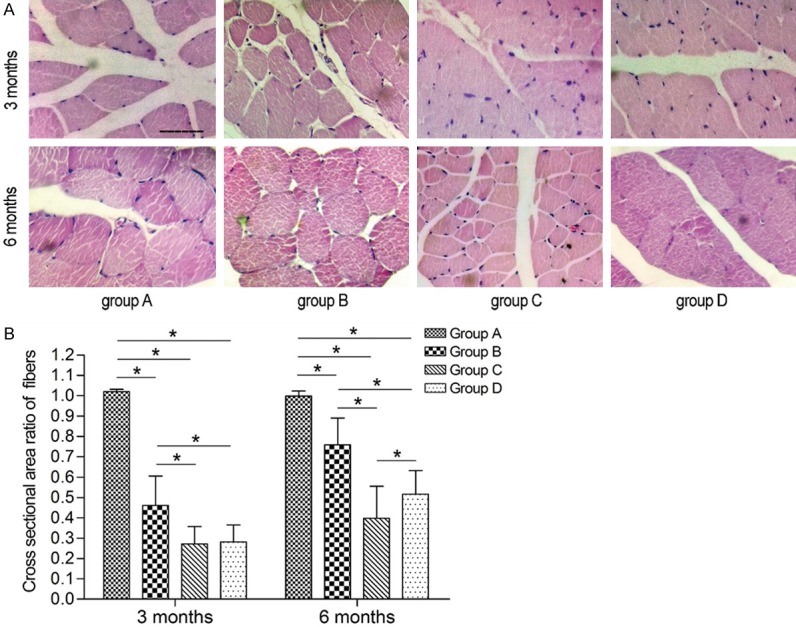
Figure 8.

Photomicrograph and Bar graphs showing histomorphology and recovery of the triceps surae muscle. A: Histomorphology of the triceps surae muscle. (Hematoxylin-eosin staining. Original magnification × 400. Bar = 50 μm). B: The recovery of muscle fiber cross-sectional area. (The asterisk indicates a statistically significant difference).
