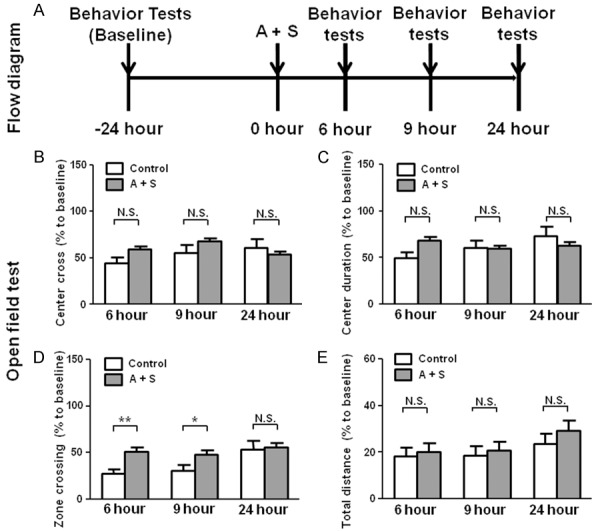
Figure 1.

The flow diagram and OFT results in the control and A + S groups. A: The flow diagram. Behavior tests, including open filed test, evaluated plus maze test and buried food test were performed 24 hours (baseline) before and 6, 9 and 24 hours after A + S, respectively. B: Center cross (Two-way ANOVA. Time: F2,44 = 10.87, P < 0.01; Group: F1,44 = 1.043, P = 0.3126; Interaction: F2,44 = 15.27, P < 0.01). C: Center duration (Time: F2,44 = 13.64, P < 0.05; Group: F1,44 = 0.1048, P = 0.7477; Interaction: F2,44 = 29.21, P < 0.001). D: Zone crossing (Time: F2,44 = 24.95, P < 0.001; Group: F1,44 = 3.792, P = 0.0479; Interaction: F2,44 = 9.685, P < 0.01). E: Total distance: (Time: F2,44 = 7.057, P < 0.01; Group: F1,44 = 0.2497, P = 0.6198; Interaction: F2,44 = 0.4298, P = 0.652). ANOVA: analysis of variance; A + S: anesthesia and surgery; CsA: cyclosporine A; N.S.: not significant; OFT: open field test. Data are shown as mean ± S.E.M. (n = 14 or 46). *P < 0.05, **P < 0.01, ***P < 0.001.
