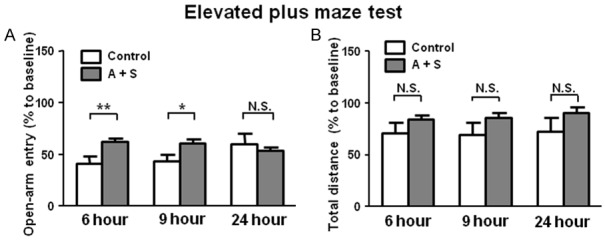
Figure 2.

EPMT results in the control and A + S groups. A: Open-arm entry (Two-way ANOVA. Time: F2,44 = 1.254, P = 0.293; Group: F1,44 = 5.366, P < 0.05; Interaction: F2,44 = 8.647, P < 0.001). B: Total distance (Time: F2,44 = 5.31, P < 0.01; Group: F2,44 = 2.479, P = 0.1226; Interaction: F2,44 = 1.408, P = 0.25). ANOVA: analysis of variance; A + S: anesthesia and surgery; EPMT: elevated plus maze test; N.S.: not significant. Data are shown as mean ± S.E.M. (n = 14 or 46). *P < 0.05, ***P < 0.001.
