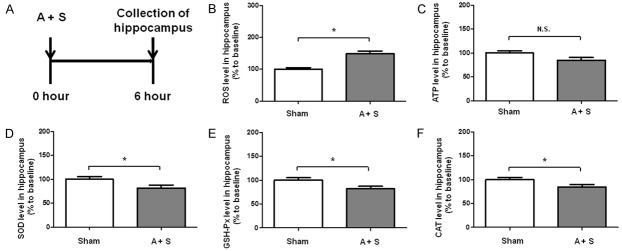
Figure 4.
Hippocampal levels of ROS, ATP, SOD, GSH-Px and CAT in the control and A + S groups. A: The flow diagram. B: ROS level in hippocampus (t = 2.59, P < 0.05); C: ATP level in hippocampus (t = 1.242, P = 0.2194); D: SOD level in hippocampus (t = 2.163, P = 0.0371); E: GSH-Px level in hippocampus (t = 2.489, P = 0.0173); F: CAT level in hippocampus (t = 2.125, P = 0.0379). A + S: anesthesia and surgery; ATP: adenosine triphosphate; CAT: catalase; GSH-Px: glutathione peroxidase; N.S.: not significant; ROS: reactive oxygen species; SOD: superoxide dismutase. Data are shown as mean ± S.E.M. (n = 14 or 46). *P < 0.05.

