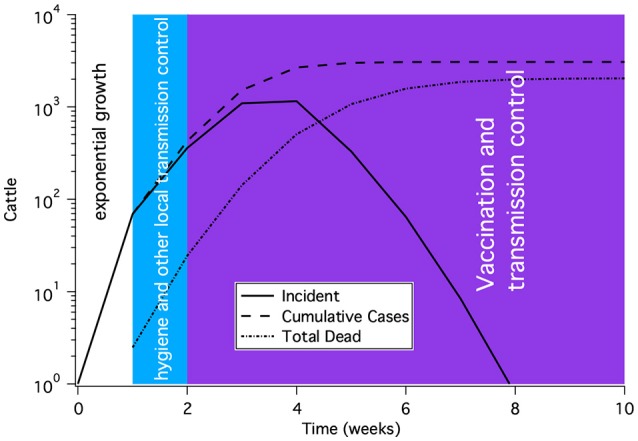
Figure 12.

A representative time course for a rinderpest epidemic subject to modern epidemic response and control. The shape of the curve shows initial exponential rise, a slow down in growth due to transmission reduction and finally control of the epidemic after several weeks of vaccination. This time course is not meant to represent a particular outbreak, but rather to illustrate the general features of an outbreak.
