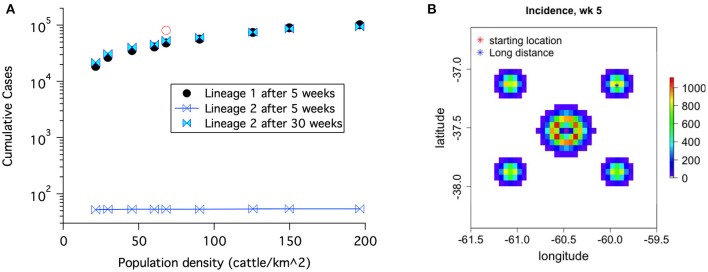
Figure 8.
(A) Cumulative case counts at the end of the simulation increase with population density. (B) Geographical spread of disease including both local and long distance spread for lineage-1 at 5 weeks. The red open circle in (A) corresponds to results with the 1% spread to the four long distance locations shown in (B).

