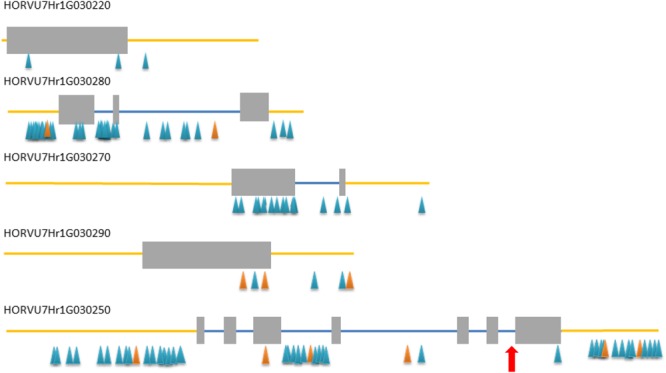
FIGURE 2.

Exon–intron structure of five high confidence (HC) genes from the target interval. Gray rectangles – exons, blue lines – introns, yellow line – upstream and downstream region, blue/orange triangles – SNP/InDel polymorphisms detected between rhl1 mutant and cv. ‘Morex’. Red arrow indicates the position of a mutation in HORVU7Hr1G030250 differing rhl1.b mutant and cv. ‘Karat’.
