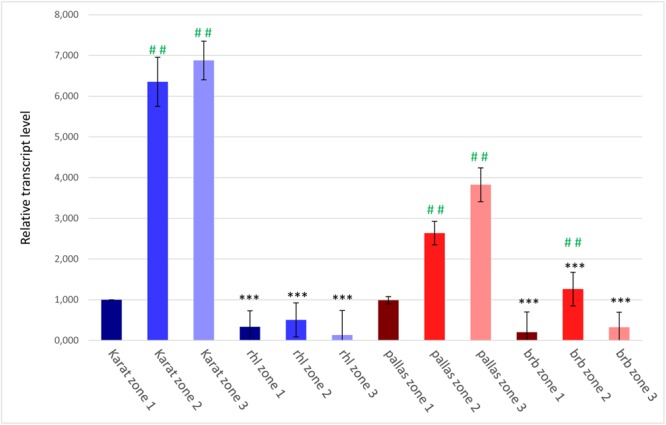
FIGURE 7.

The expression levels of the candidate HvRhl1 gene in three zones of the roots of ‘Karat’ and ‘Pallas’ varieties and rhl1.b and brb mutants. The fold change of gene expression for each root zone of the specific genotype (‘Pallas’, ‘Karat’, rhl1.b, brb) was normalized to the gene expression level characteristic for ‘Karat’ root apical zone (zone 1), which was considered as the value of 1. Black asterisks indicate the significant differences between the mutants and their parents regarding the corresponding root zones. Green hashes indicate the significant differences between zone 1 and either zones 2 or 3 within the single genotype. ∗∗∗P ≤ 0.001; ∗∗P ≤ 0.01; ∗P > 0.05. ###P ≤ 0.001; ##P ≤ 0.01; #P > 0.05. The analysis was performed using three biological replicates.
