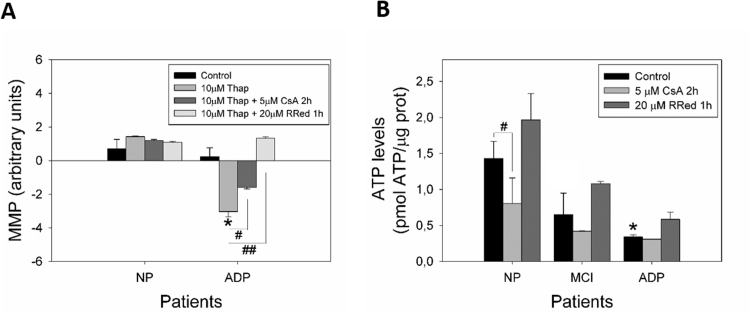
Fig. S3.
Comparison of MMP and ATP levels after Cyclosporin A and Ruthenium Red treatments A. Quantification of TMRM signal in basal state after thapsigargin, after thapsigargin plus CsA, and after thapsigargin plus RRed treatments. *p < 0.05 indicates differences in basal state; #p < 0.05, ##p < 0.001 indicates differences between control and drug treatment calculated by Student's t-test. B. Total ATP levels (pmol) normalized by micrograms of protein extracted from control, MCI, and AD fibroblasts before and after drugs treatments. Data are represented as mean ± SE; n = 3 technical replicates for each subject. *p < 0.05 indicates differences from control patients, #p < 0.05 indicates differences between control and drug treatment calculated by Student's t-test.

