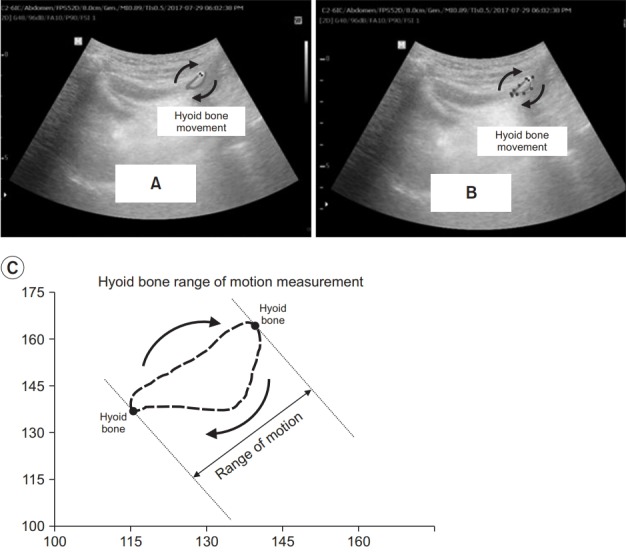
Fig. 3.

The range of the hyoid bone movement depicted by a tracer marker at the ultrasonography video taken using a Kinovea v.0.8.15 software (microanalysis for video) (A). The marked range of motion was then measured in pixel units using imageJ, an image processing and analysis program (B). Illustration of the range-of-motion measurement for a hyoid bone trajectory. (C) The illustration shows a hyoid bone trajectory in blue over a single swallow. The initial resting position of the hyoid is marked with the black circle. The red arrow shows the direction of motion for the trajectory. The range-ofmotion measurement is made by finding the largest displacement between any two points on the hyoid bone trajectory during the swallow shown in red dots.
