
Fig. 6.
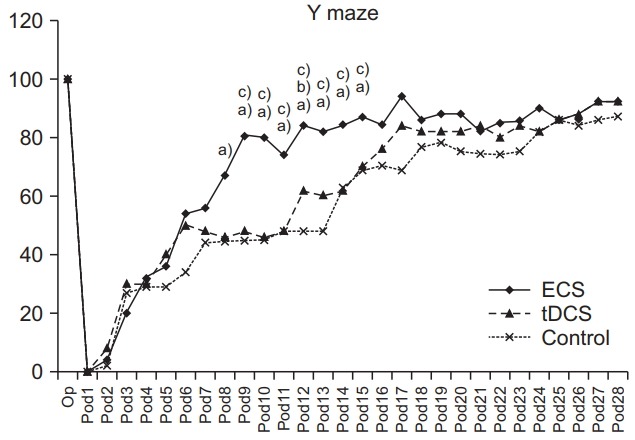
The success rates of the Y-maze test in ECS, tDCS, and control groups. Success rates of ECS groups were higher from day 9 to day 15 than that of tDCS and from day 8 to day 16 than that of the control group. On days 6, 12, and 16, the tDCS was significantly higher compared with the control group. ECS, electric cortical stimulation; tDCS, transcranial direct current stimulation. One-way ANOVA with Scheffe post-hoc test and Bonferroni correction after repeated measures ANOVA. a)p<0.05 by oneway ANOVA between ECS and control groups on days 8–16. b)p<0.05 by one-way ANOVA between tDCS and control groups on days 6, 12, and 16. c)p<0.05 by one-way ANOVA between ECS and tDCS groups on days 9–15.