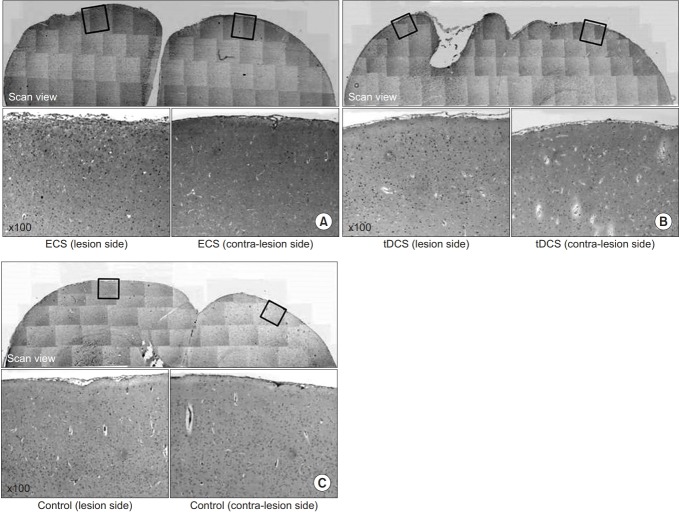
Fig. 9.
Immunohistochemistry staining for c-Fos protein in the cerebral cortex of the lesion side and contra-lateral side for the ECS group (A), the tDCS group (B), and the control group (C). In (A), note the increase of c-Fos expression in the both cerebral cortex and much more increased in the lesion side. In (B), note the increase of c-Fos expression in the both cerebral cortex and much more increased in the lesion side. In (C), there are a few c-Fos expressed in the cerebral cortex of both sides. ECS, electric cortical stimulation; tDCS, transcranial direct current stimulation.

