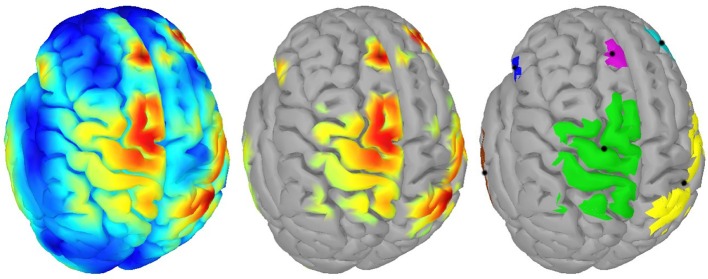
Figure 1.
Example of clustering: (Left) Source activity distribution of one subject; (Middle) The top 5% of active sources (i.e., 750 colored vertices); (Right) Six computed clusters using DBSCAN (Ester et al., 1996) after hemispheres were separated. The black dots indicate the centers of mass.

