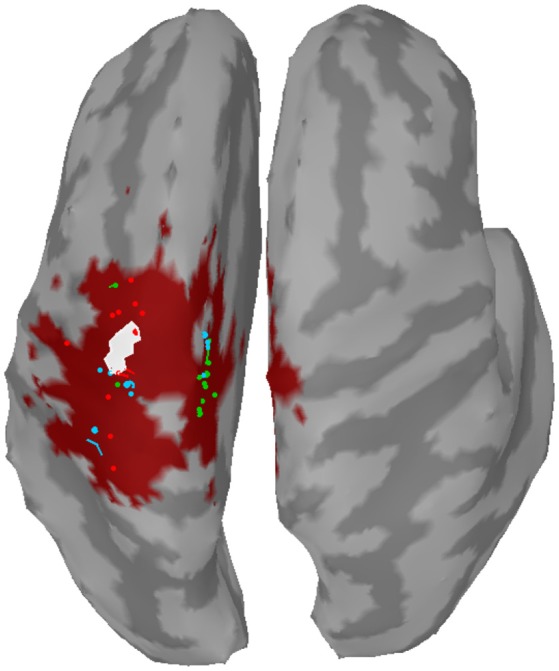
Figure 4.

Centers of mass (points) of the nearest clusters to the reference region (white) for all subjects and training sets. Red: wMNE; Green: dSPM; Blue: sLORETA. The dark red shaded area depicts the region of highest classification performance (BA) when ~25 adjoint vertices were selected for feature extraction.
