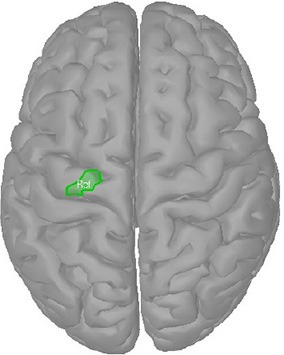
Table 2.
Determination of the reference region.
| Talairach coordinates | MNI coordinates | Reference coordinates | |||||||||
|---|---|---|---|---|---|---|---|---|---|---|---|
| Study | Method | x | y | z | x | y | z | x | y | z | |
| Grafton et al., 1993 | PET | −22 | −22 | 60 | −22 | −17 | 65 | −16.6 | −17.8 | 65.8 |  |
| Lotze et al., 2000 | fMRI | −28 | −24 | 64 | −28 | −19 | 69 | −28.0 | −24.6 | 70.0 | |
| Alkadhi et al., 2002 | fMRI | −29 | −25 | 61 | −29 | −20 | 66 | −28.3 | −24.3 | 62.9 | |
| −29 | −26 | 62 | −29 | −21 | 67 | −28.0 | −24.6 | 70.0 | |||
Left: Talairach coordinates of maximum activation during right elbow movements. An MNI-to-Talairach transformation (Lancaster et al., 2007) was applied to convert Talairach to MNI coordinates (Radua and Mataix-Cols, 2015). Finally, the reference coordinates, i.e., the closest points in the source space to the MNI coordinates, were calculated.Right: Reference region mapped onto the cortex surface of the ICBM152 template, i.e., the source space for source localization.
