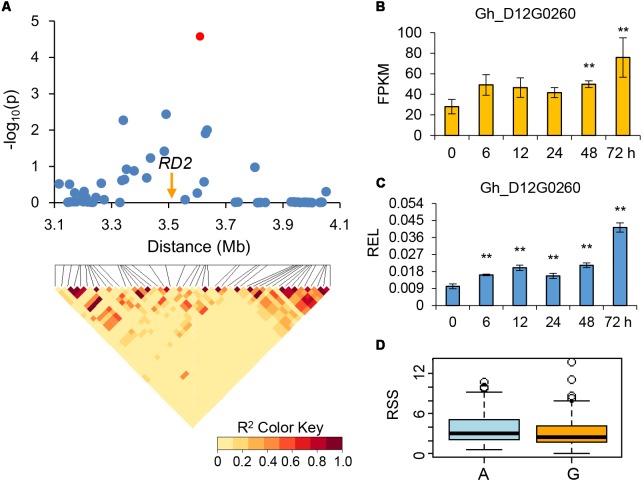
FIGURE 4.
Genome-wide association study (GWAS) for drought-tolerance and identification of the candidate gene RD2 on chromosome D12. (A) Local Manhattan plot (top) and LD heat map (bottom). The red dot indicates the SNP related to the drought-tolerance trait. The arrow indicates the location of RD2. (B) The expression level of the candidate gene RD2 calculated via RNA-Seq. (C) The relative expression level (REL) of the candidate gene RD2 calculated via qRT-PCR. (D) Differences of relative soluble sugar content (RSS) among two haplotypes. ∗∗ means the 1% level of significance.

