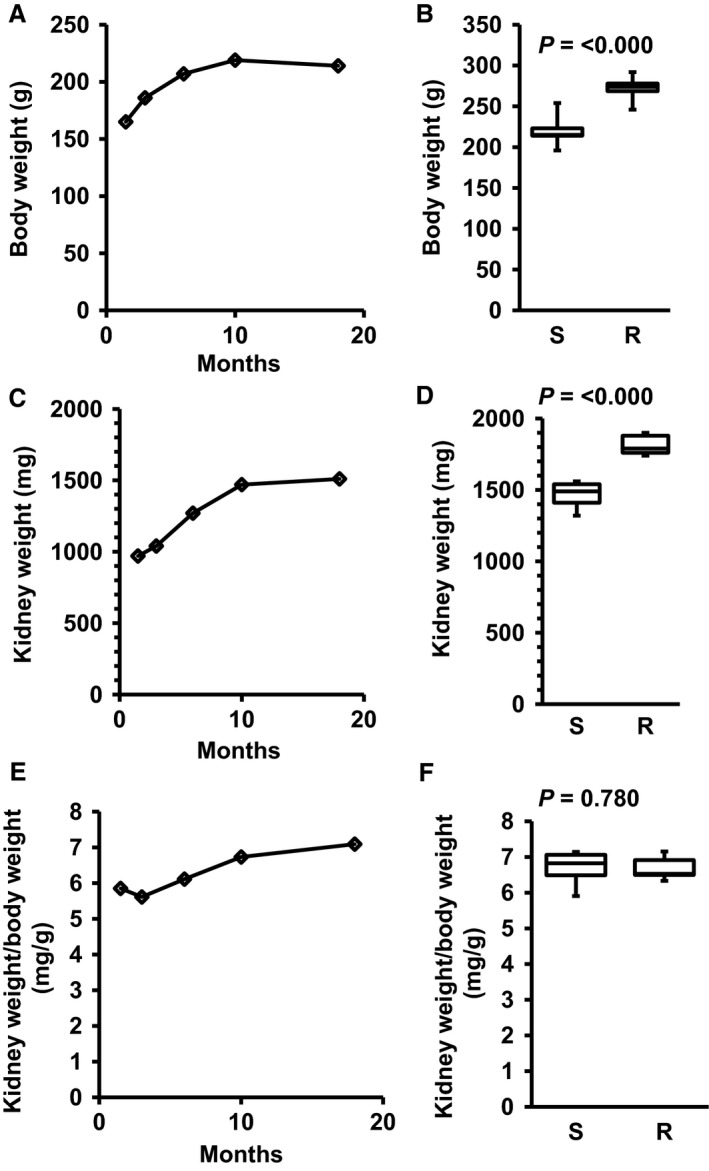
Figure 1.

Development of body weight (A), kidney weight (C), and kidney weight to body weight (E) in sedentary SHRs (S) and the effect of free running wheel exercise (R) on these parameters (B, D, F) after 10 months. Data are means for time profiles and box plots representing the 25th, 75th quartile, and median, with whiskers representing the lowest and highest values (range). Data are from n = 6 rats at each time point and group. Exact P‐values are given.
