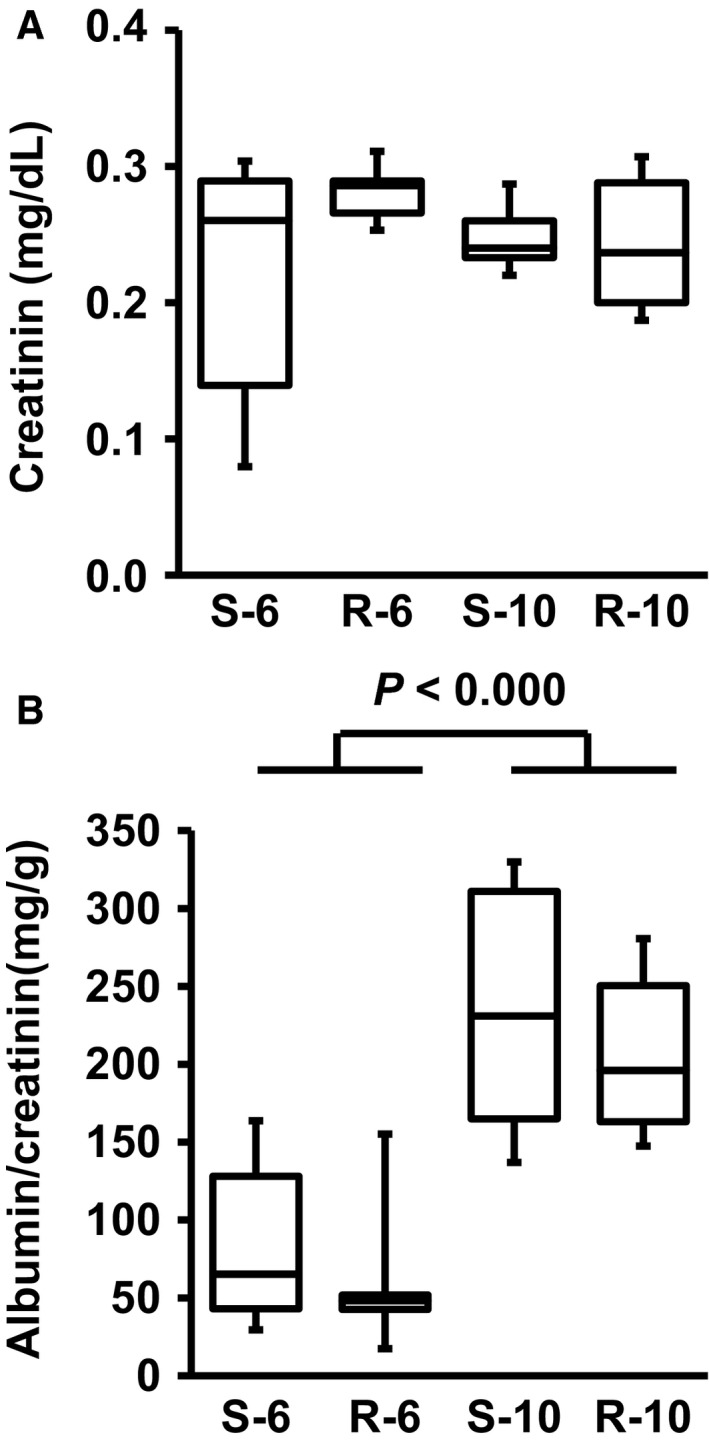
Figure 2.

Plasma creatinine (A) and urine albumin‐to‐creatinine ratios (B) from sedentary (S) or running (R) SHRs at the age of 6 or 10 months. Data are means for time profiles and box plots representing the 25th, 75th quartile, and median, with whiskers representing the lowest and highest values (range). Data are from n = 6 rats at each time point and group. P > 0.05.
