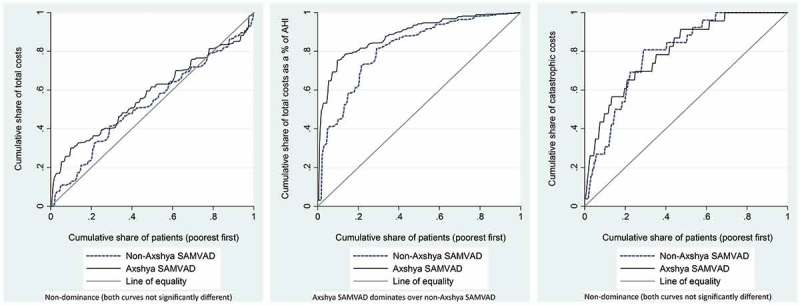
Figure 2.

Concentration curves for total costs, total costs as a proportion of pre-TB annual household income and catastrophic costs due to TB diagnosis, stratified by Axshya SAMVAD and non-Axshya SAMVAD groups, among TB (new sputum-smear-positive) affected households in India, 2016–2017*. SAMVAD: sensitisation and advocacy in marginalised and vulnerable areas of the district; Axshya SAMVAD: an active case finding strategy under project Axshya implemented by The Union, South East Asia office, New Delhi, India, across 285 districts of India; TB: tuberculosis; AHI: annual household income. *For the indicator ‘total costs’, we assumed equity if the concentration curve/index revealed significant distribution across the richest quintiles (positive concentration index, 95% CI not including zero). For the indicators, ‘total costs as a proportion of pre-TB annual household income’ and ‘catastrophic costs’, we assumed equity if the concentration curve/index revealed equal distribution across the quintiles (concentration curve not significantly different from the line of equality). For details on the dominance test, readers are requested to refer to O’Donnell et al. [30].
