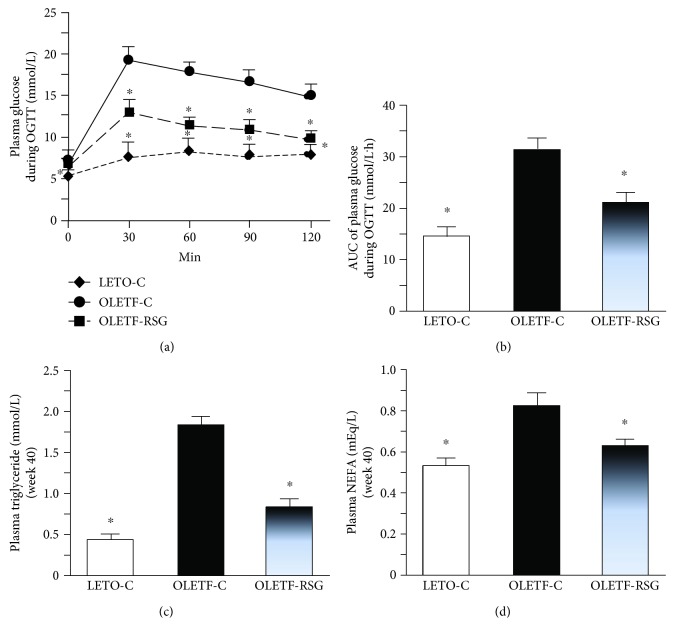
Figure 2.
Blood glucose concentrations at different time points (a), the AUC of glucose concentrations (b) during oral glucose tolerance test (OGTT), and fasting plasma triglyceride (c) and NEFA (d) concentrations in LETO-C, OLETF-C, and OLETF-RSG groups. Data are means ± SD (n = 8 each group) versus OLETF group (∗P < 0.05).

