Figure 1.
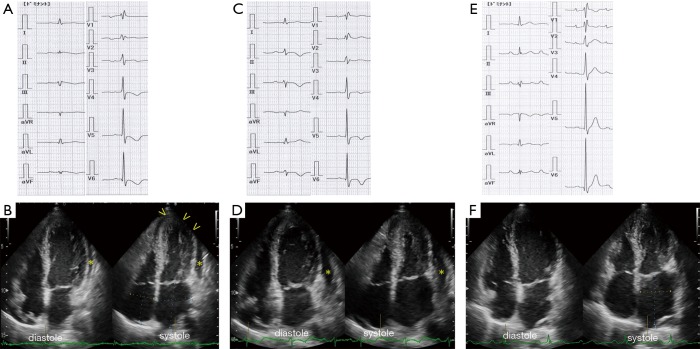
Electrocardiogram (ECG) and echocardiogram. (A) Upon admission, an ECG shows incomplete right bundle-branch block, elevated ST-segments in leads II, III, and aVF, and inverted T-waves in leads V3–6, and a prolonged QTc of 0.45 s; (B) a two-dimensional (2D) echocardiogram, apical four-chamber view, demonstrates left ventricular apical hypokinesis (arrowheads) and pericardial effusion (asterisk); (C) 5 days later, an ECG shows iso-electric ST segments in leads II, III, and aVF, and inverted T-waves in in leads II, III, aVF and V4–6; (D) a repeat 2D echocardiogram demonstrates recovery of left ventricular wall motion and increased pericardial effusion (asterisk); (E) 5 months later, an ECG shows upright T-waves in leads II, III, aVF and V4–6; (F) a 2D echocardiogram demonstrates resolution of the pericardial effusion.

