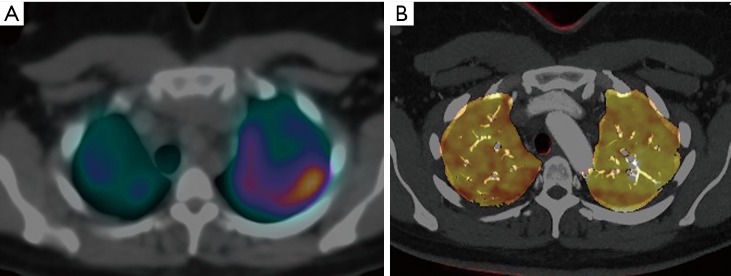
Figure 4.
Representative example of discrepancy in the subjective assessment of perfusion on DECT and SPECT-CT V/Q scanning. (A) Fused SPECT-CT V/Q scan image in the upper lungs shows poor perfusion in the right upper lobe; (B) corresponding fused DECT-PBV image at the same level shows relatively symmetric and normal perfusion in both upper lobes.

