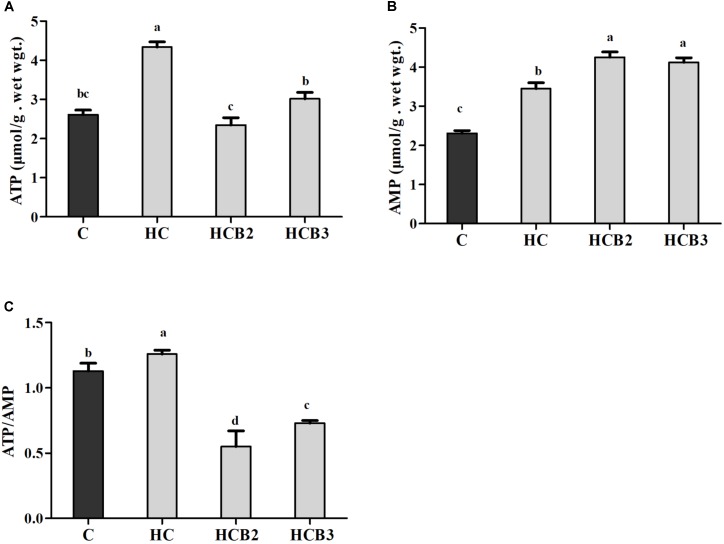
FIGURE 1.
Hepatic ATP (A) and AMP (B) contents and the ATP/AMP ratio (C) of blunt snout bream fed different experimental diets. Each data represent the means ± SEM of four replicates. Bars assigned with different superscripts are significantly different (P < 0.05). ATP, adenosine triphosphate; AMP, adenosine monophosphate.

