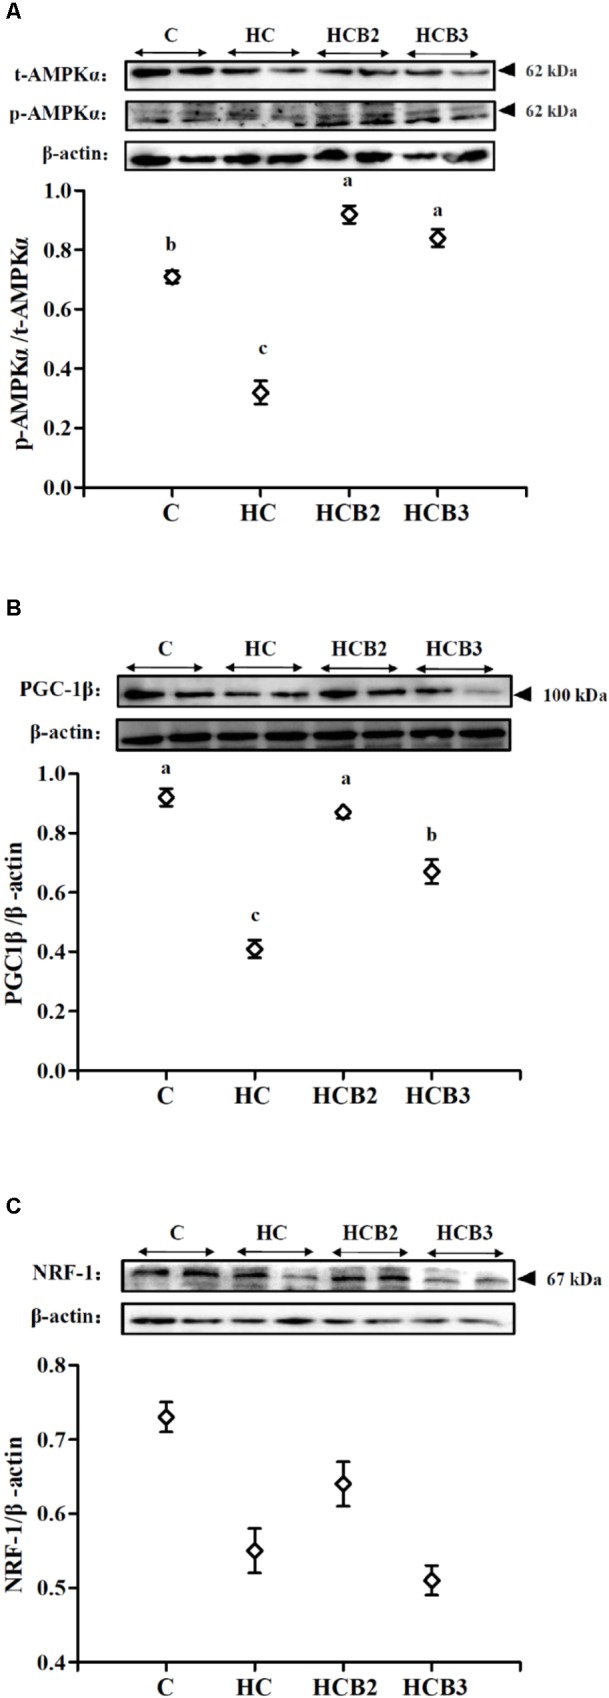
FIGURE 2.

The protein expressions of AMPKα (A), PGC-1β (B), and NRF-1 (C) in the liver of blunt snout bream fed different experimental diets. Two blots were presented for each treatment. Gels were loaded with 20 μg total protein per lane. Each data represent the means ± SEM of four biological replicates. Bars assigned with different superscripts are significantly different (P < 0.05).
