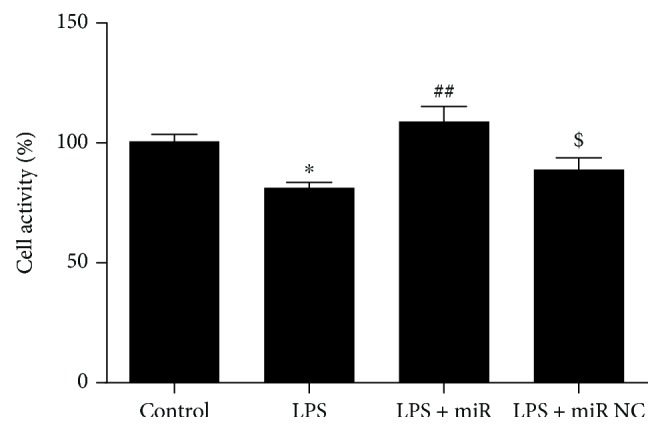
Figure 3.

The change of cell viability detected by CCK8. Data were expressed as mean ± SEM. ∗P < 0.05 versus the control group; ##P < 0.01 versus the LPS group; $P < 0.05 versus the LPS + miR group.

The change of cell viability detected by CCK8. Data were expressed as mean ± SEM. ∗P < 0.05 versus the control group; ##P < 0.01 versus the LPS group; $P < 0.05 versus the LPS + miR group.