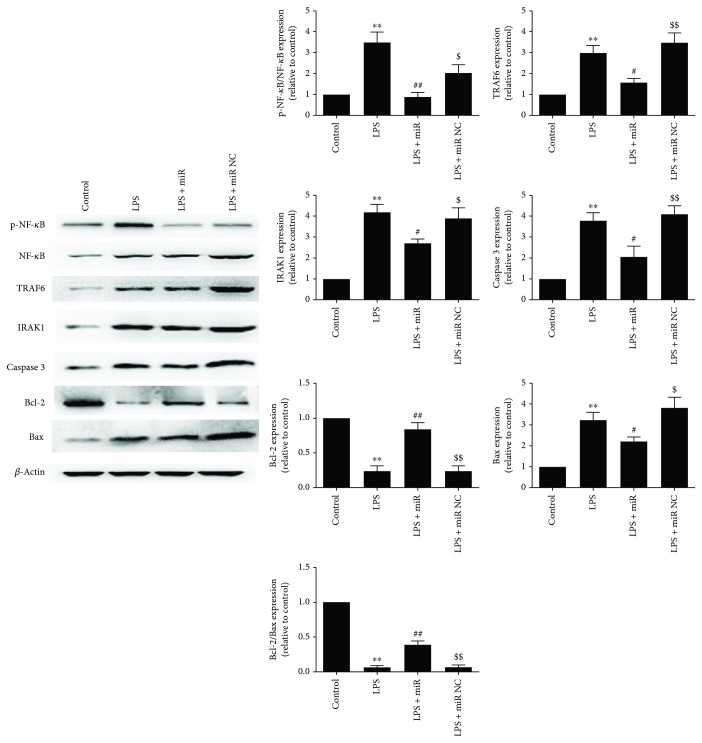
Figure 5.
Overexpression of miR-146a downregulated TRAF6 and IRAK1 expression and suppressed NF-κB activity in cardiomyocytes following LPS treatment. Representative images of the Western blot results are shown. The values were expressed as the mean ± SEM. ∗∗P < 0.01 versus the control group; #P < 0.05 versus the LPS group; ##P < 0.01 versus the LPS group; $P < 0.05 versus the LPS + miR group; $$P < 0.01 versus the LPS + miR group.

