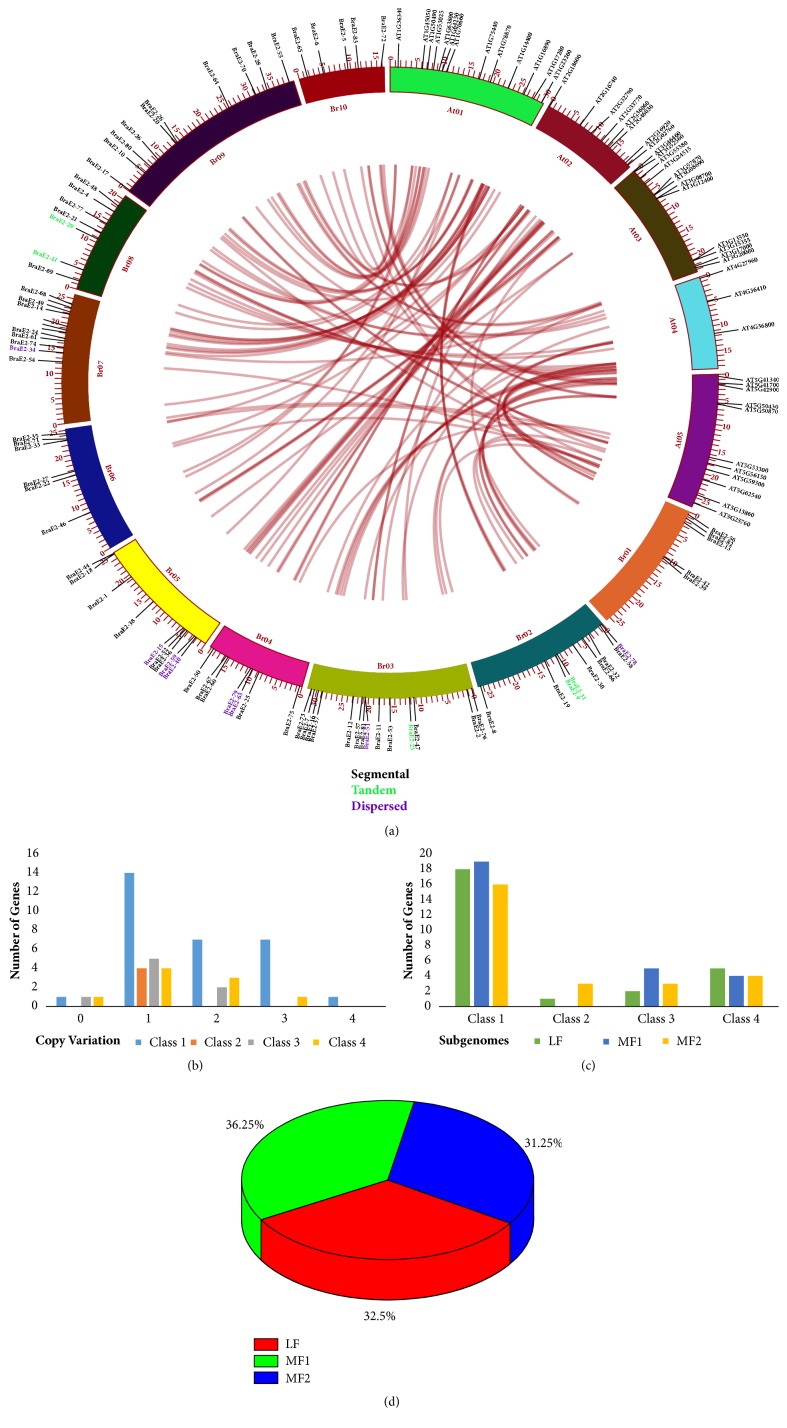
Figure 3.
(a) The collinear correlation for all the genes of BraE2 was displayed between B. rapa and A. thaliana. The ten Chinese cabbage chromosomes (Br01-Br10) and the five A. thaliana chromosomes (At1-At5) are shown in different random colors. The illustration was drawn using Circos Software. For duplication types, tandem array was displayed with green color and dispersed with purple. (b) Showing copy number of variation among different subclasses of BraE2s. (c) Showing number of genes based on 4 different subclasses of BraE2s. (d) Showing the ratio of BraE2 genes among three subgenomes of B. rapa.

