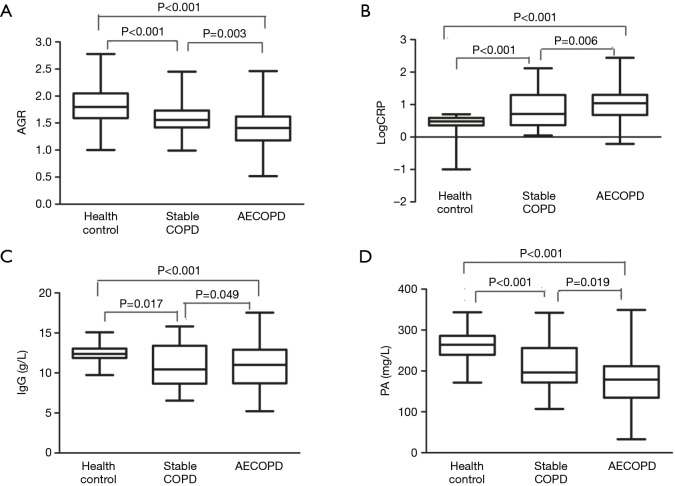
Figure 1.
(A) AGR, (B) LogCRP, (C) IgG, and (D) PA in AECOPD patients, stable COPD patients, and healthy controls. Data are presented as box plots representing median values with interquartile ranges. P values of <0.05 indicate a statistically significant difference. The P values were calculated by. one-way analysis of variance. AGR, albumin/ globulin ratio; LogCRP, logarithm of the serum C-reactive protein; IgG, immunoglobulin G; PA, prealbumin; AECOPD, acute exacerbation of chronic obstructive pulmonary disease; COPD, chronic obstructive pulmonary disease.

