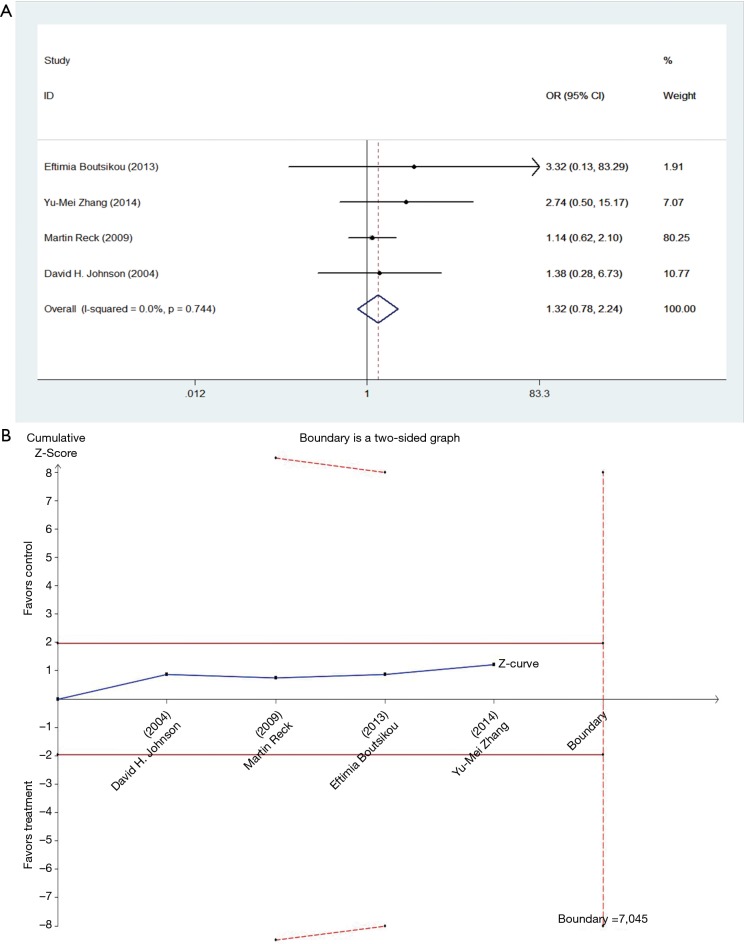
Figure 5.
The forest pot and TSA of the odds ratio of low dose bevacizumab associated thromboembolism events. (A) OR of low dose bevacizumab associated thromboembolism’s events; (B) Z-curve did not cross the trial sequential monitoring boundary for hazard (red dotted curve) and did not reach the required sample size based on TSA (n=846), either entering the area of hazard (underneath the upper red line). OR, odds ratio; CI, confidence interval; TSA, trial sequence analysis.

