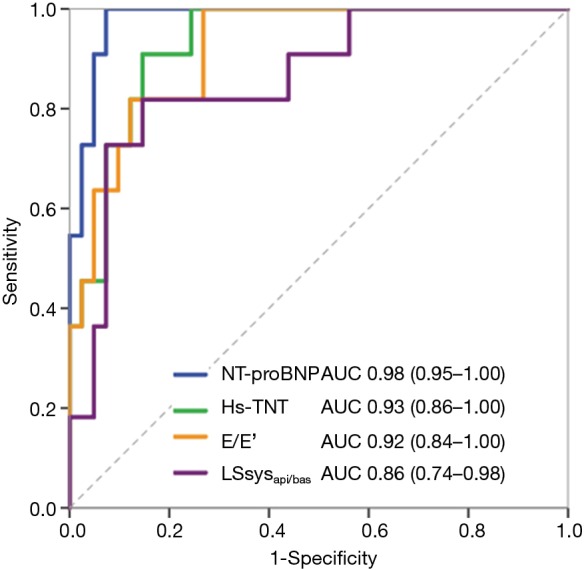
Figure 3.

ROC curves of hs-TNT, NT-proBNP, and other echocardiographic markers (E/E’ and LSsysapi/bas) for differentiating CA from FA and FD patients. E/E’, the ratio between mitral inflow velocity and mitral annular velocity at early-diastole; LSsysapi/bas, the ratio between apical and basal septal longitudinal systolic strain; FA, Friedreich’s Ataxia; FD, Fabry disease; CA, light-chain cardiac amyloidosis; ROC, receiver operating characteristic; hs-TNT, high sensitive troponin T; NT-proBNP, N-terminal pro-brain natriuretic peptide.
