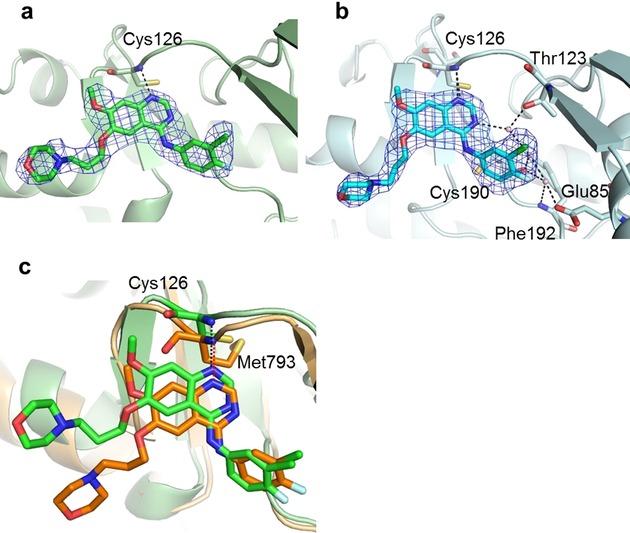
Figure 3.

Comparison of gefitinib binding at the GAK ATP binding site. Gefitinib binding at the ATP binding site of a) GAK_1 and b) GAK_2. Gefitinib is shown as a stick model with the backbone carbons in green (GAK_1) and cyan (GAK_2) and the 2 F o−F c electron density map (1σ). c) Superimposed structures of GAK_2 (green ribbon structure) and EGFR (orange ribbon structure). Gefitinib molecules are shown as a green (GAK_2) and orange (EGFR) stick model.
