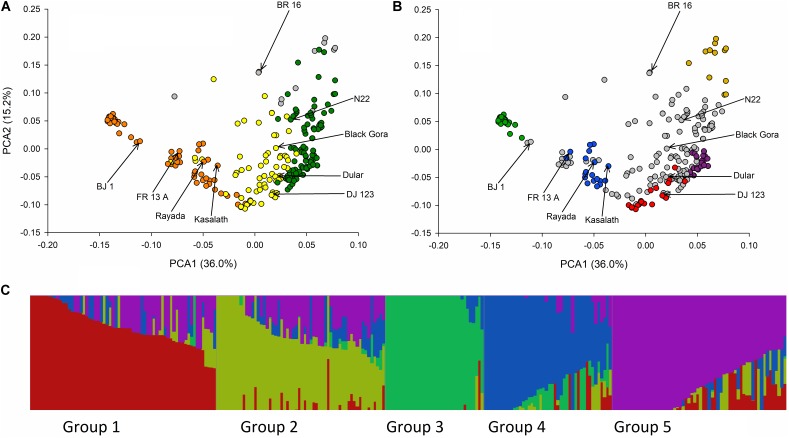
FIGURE 2.
Principle components and fastSTRUCTURE analysis of BAAP. (A) Biplot of the first two PCA axis of the 266 aus accessions of the BAAP using 2,053,863 SNPs color coded according to the classification of population groups of Travis et al. (2015) based on 326 SNPs where orange is “aus-1,” green is “aus-2,” yellow is “aus-admix,” and gray is “admix.” (B) Same PCA biplot color coded according to K = 5 fastSTRUCTURE subgroups where group 1 is red, group 2 is yellow, group 3 is green, group 4 is blue, group 5 is purple, and accessions that do not fall into these groups are gray. (C) Distruct (Rosenberg, 2004) plot of fastSTRUCTURE subpopulation membership coefficients with K = 5.

