
Figure 3. The same parameter change leads to different phenotypes in the two network types.
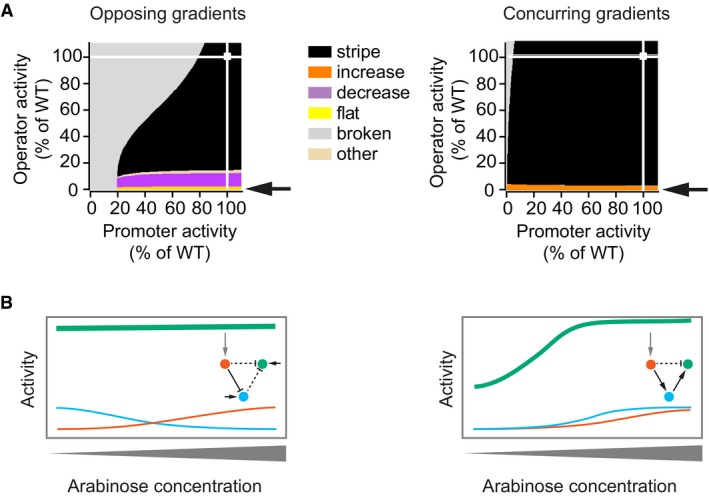
- Phenotype diagrams for parameters that describe the activity of the “green” gene. Horizontal and vertical axes indicate promoter and operator activities of the “green” gene relative to the wild‐type value (WT, 100%). All parameters affecting the promoter or operator were varied jointly and to the same extent. Colours indicate phenotypes predicted by the model over the whole range of promoter and operator activity values. White squares indicate the parameter combination of the unmutated circuit, which produces the “stripe” phenotype, and white lines are visual guides that project these values onto the two parameter axes. Arrows point to the phenotype observed when operator activity decreases to a value near zero per cent.
- Schematic drawing of how a strong reduction in operator activity of the “green” gene affects gene expression patterns differently in the two types of networks. Insets: topologies of the networks, with dashed lines indicating interactions affected by mutations in the operator.