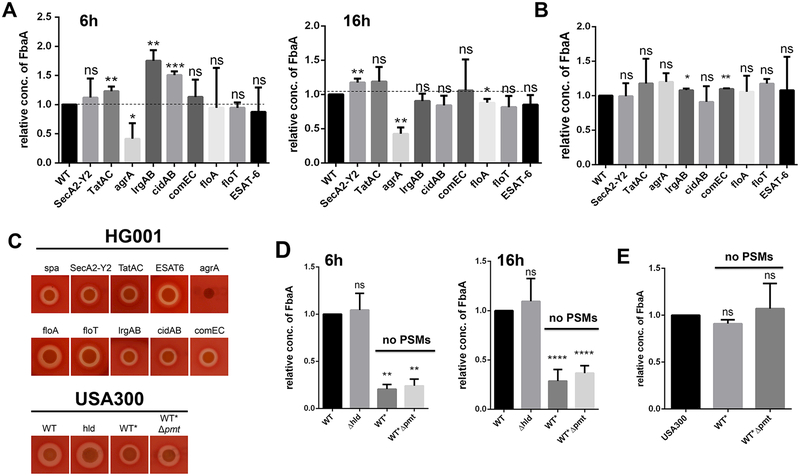
Figure 1: Excretion of FbaA is decreased in an agrA and PSM mutants.
(A) Relative amounts of FbaA in the supernatant of HG001 and its isogenic secA2-Y2, tatAC, agrA, lrgAB, cidAB, comEC, floA, floT and ESAT-6 deletion mutants after 6h and 16h. The dashed line represent an amount equal to that of the WT. (B) Relative amounts of FbaA in the cytoplasm of HG001 and its isogenic secA2-Y2, tatAC, agrA, lrgAB, cidAB, comEC, floA, floT and ESAT-6 deletion mutants after 16h of growth. (C) Hemolysis test of the HG001 and secA2-Y2, tatAC, agrA, lrgAB, cidAB, comEC, floA, floT, ESAT-6, USA300hld::hldMet→Ile, WT* and WT*Δpmt deletion mutants on sheep blood agar plates. (D) Relative amount of FbaA in the supernatant in USA300, USA300hld::hldMet→Ile, WT* and WT*Δpmt after 6h and 16h. (E) Relative amount of FbaA in the cytoplasm of USA300, hld::hldMet→Ile, WT* and WT*Δpmt after 6h. Representative data from three independent experiments are shown. For all graphs, each data point is the mean value ± SD (n = 3) *p < 0.05; **p < 0.01; ***p < 0.001; and ****p < 0.0001, by students t-test.

