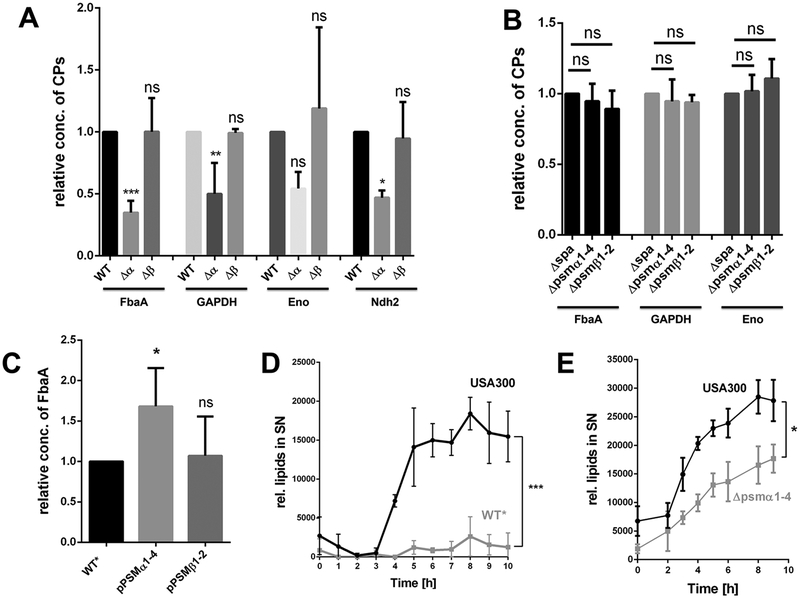
Figure 2: PSMα peptides are the driving force for ECP in USA300.
(A) Densitometric analysis of the relative amounts of FbaA, GAPDH, Enolase and Ndh2 in the supernatant of USA300Δspa and its corresponding PSMα1–4 and PSMβ1–2 mutants. (B) Relative amounts of FbaA, GAPDH and Enolase in the cytoplasm of USA300Δspa and its corresponding PSMα1–4 and PSMβ1–2 mutants. (C) Densitometric analysis for detecting the excreted FbaA in the supernatant of WT*, the complemented mutant pRAB11-psmα1–4 and WT* pRAB11-psmβ1–2 after 16h of PSM expression. (D) Release of lipids in USA300 and its and WT* mutant over a time period of 10 h, the cultures were diluted to OD578 = 1,85 for each time point. (E) Release of lipids in USA300 and its PSMα1–4 mutant over a time period of 9 h, the cultures were diluted to OD578 = 2 for each time point. Representative data from three independent experiments are shown. For all graphs, each data point is the mean value ± SD (n = 3 for ABCE, n = 2 for D) *p < 0.05; **p < 0.01; ***p < 0.001, by one-way ANOVA with Bonferroni posttest for ABC and unpaired t-test for DE.

