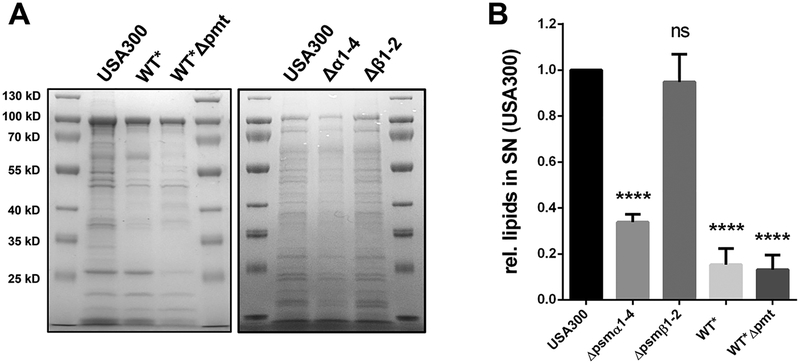
Figure 3: Deletion of of PSMα1–4 causes decreases proteins and lipids in the supernatant of USA300.
(A) SDS-PAGE of the extracellular proteins of USA300, WT*, WT*Δpmt, PSMα1–4 and PSMβ1–2 mutant after 24h of growth. (B) Relative amount of lipids in the supernatant of USA300, WT*, WT*Δpmt, PSMα1–4 and PSMβ1–2 mutant after 24h of growth. Representative data from three independent experiments are shown. For all graphs, each data point is the mean value ± SD (n = 3) *p < 0.05; **p < 0.01; ***p < 0.001; and ****p < 0.0001, by one-way ANOVA with Bonferroni posttest.

