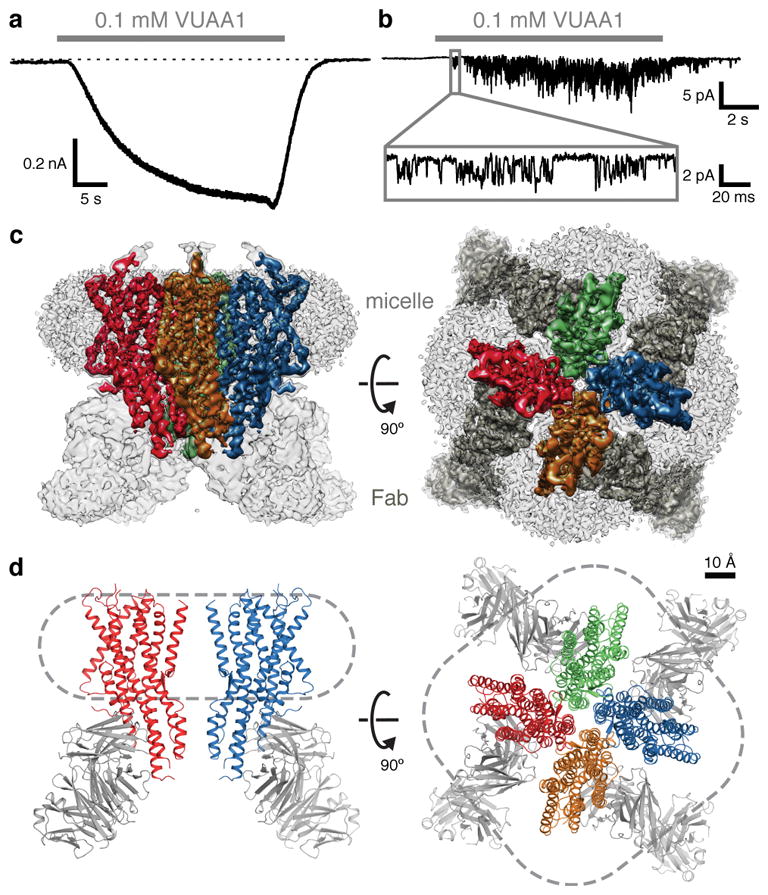
Fig. 1. Channel activity, cryo-EM density and model of the Orco-Fab complex.

a, Whole-cell voltage-clamp recording from a cell expressing Orco with local perfusion of VUAA1 (holding potential of −80 mV). Dotted line represents 0 pA. b, Outside-out patch recording at −80 mV. Inset shows single channel openings. c, Cryo-EM density of the Orco-Fab complex shown from the side (within the plane of the membrane; left) and from the top (the extracellular surface; right). Density of each Orco subunit (contoured at 6σ) is coloured differently. In the top view, Fab density is dark grey. Density of the detergent micelle (contoured at 4σ) is light grey. d, Ribbon diagrams of Orco corresponding to views shown in c. Two subunits are shown in the side view (left) while four are present in the top view (right). Dashed lines indicate micelle outlines. The Fabs were not modeled and are included in d for illustrative purposes only.
