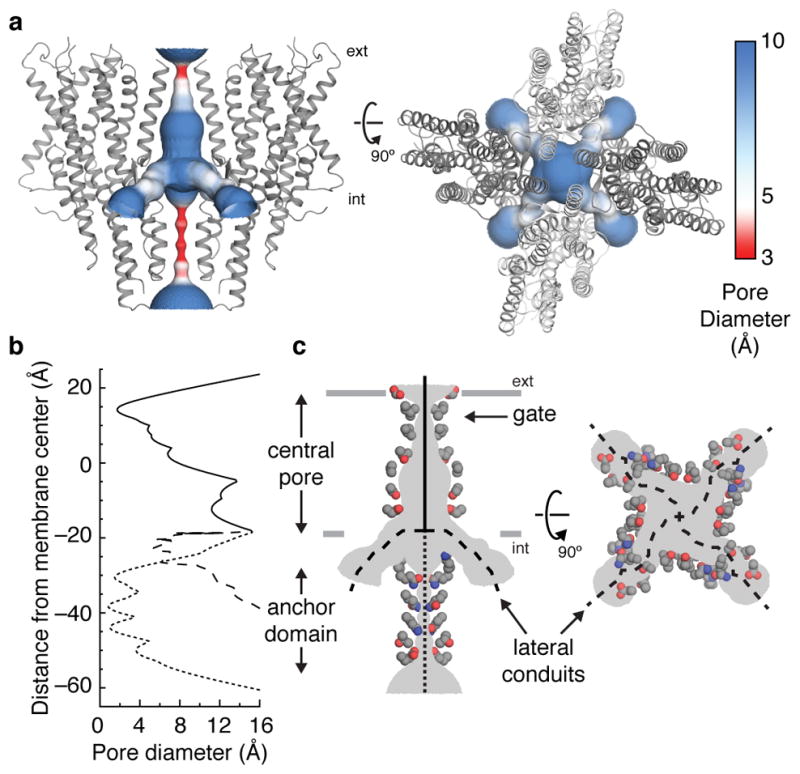
Fig. 3. The ion-permeation pathway.

a, The channel pore, coloured according to pore diameter, is shown from the side (left) and top (right). Orco subunits are shown as grey ribbons. b, The diameter along the central pore (solid line), anchor domain (dotted line) and lateral conduits (dashed line) are plotted along the membrane normal. c, Side chains of residues that line the ion-conduction pathway are shown as coloured spheres (grey carbons, blue nitrogens and red oxygens).
