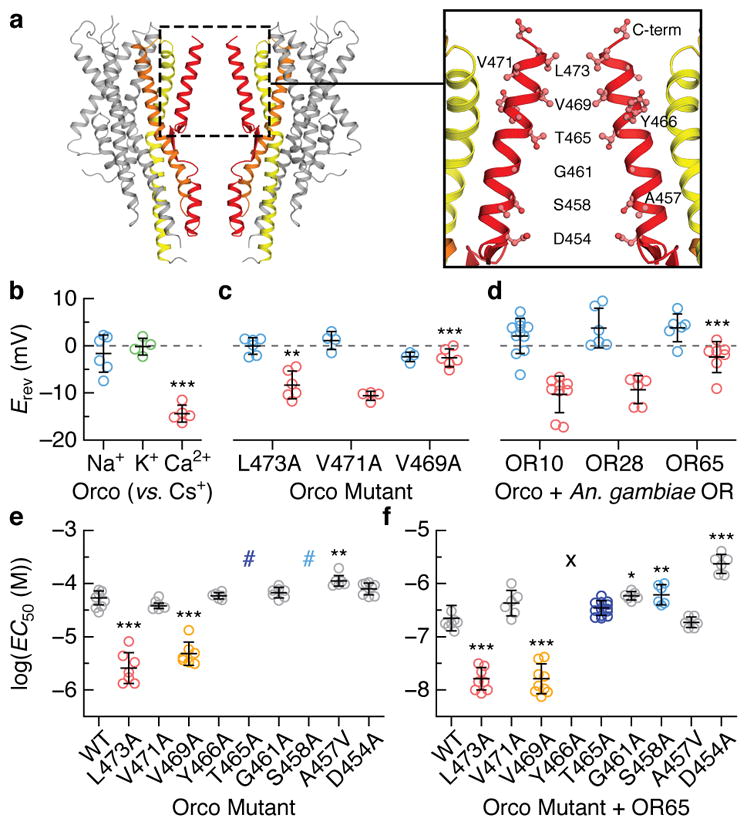
Fig. 4. A hydrophobic gate contributes to ion selectivity.

a, Location of residues lining the central pore. b–d, Reversal potentials (Erev; independent replicates and mean ± s.d) for wild-type and mutant Orcos alone or with An. gambiae ORs (intracellular CsCl with extracellular NaCl (blue), KCl (green) or CaCl2 (red)). Asterisks represent Erev that are significantly different from wild-type Orco with the same ions. e,f, Average fitted concentrations for half-maximal response (EC50; independent replicates and mean ± s.d.) for (e) wild-type (WT) and mutant Orco alone or (f) with OR65. Dose-response curves that did not saturate are indicated by #; a lower-bound EC50 estimate is ~3×10⁻⁴ M. No binding observed indicated by the X. Asterisks indicate EC50 that are significantly different from wild-type Orco or Orco-OR. In b–f, statistical significance was determined using one-way ANOVA tests followed by Tukey-Kramer multiple comparison tests; P value <0.05 (*), <0.01 (**), <0.001(***). See Extended Data Figs. 7–8 for additional statistical information.
